(地点已脱敏)·情况报告(1996年9月)· 案 D48
摘要 Summary
该报告由研究三角研究所(RTI)为美国空军第45太空翼(AFSPC)安全办公室和第30太空翼(AFSPC)安全办公室准备。报告分析了可能导致航天器偏离预定飞行线的失败情况,并模拟了某些模式5故障。报告还包含了对东方和西方发射场从每个项目开始到1996年8月的阿斯、德尔塔和土星导弹和航天器发射的简要失败历史。报告中的某些部分被涂黑。
The report was prepared by the Research Triangle Institute (RTI) for the 45th Space Wing (AFSPC) Safety Office and the 30th Space Wing (AFSPC) Safety Office of the United States Air Force. The report analyzes failure scenarios that could cause spacecraft to deviate from the intended flight path and simulates certain Mode-5 failures. The report also includes a brief failure history of the Atlas, Delta, and Titan missile and spacecraft launches from the Eastern and Western ranges from the beginning of each program through August 1996. Some parts of the report are redacted.
原档图像 Embedded Pages · 12 extracted
从 PDF 内提取,最多 12 张代表性页面/影像。完整内容请下载原档。
关键段落对照 Bilingual Excerpts
标签 Tags
展开原文抽取(pdftotext,未翻译) · Show extracted source
== �-== -=--=- �=------===--====-==-=--=-=-==-__;;;;.______________
RESEARCH TRIANGLE INSTITUTE /RTI
Contract No ■- FO4703-91-C-0112
RTI Report No. RTl/5180/77-43F
September 10, 1996
Modeling Unlikely Space-Booster
Failures in Risk Calculations
Final Report
Prepared for
Department of the Air Force
45th Space Wing (AFSPC)
Safety Office - 45 SW/SE
Patrick AFB, FL 32925
and
Department of theAir Force
30th SpaceWing (AFSPC)
19961025 122 Safety Office- 30 SW/SE
Vandenberg AFB, CA 93437
Distribution authorized to US Government agencies and their contractors to protect administrative/
operational use data, 10 September 96. Other requests for this document shall be referred to the 30th Space
Wing (AFSPC) Safety Office (30 SW/SE), Vandenberg AFB, CA 93437, or 45th Space Wing (AFSPC)
Safety Office (45 SW/SE), Patrick AFB, FL 32925.
'mJC QUALITY INSPECTED ff
3000 N. Al1antic Avenue • Cocoa Beach, Flo 0ida 329315029 US/1
- --- - - - - - - - - - - - - - - - - - - - - - ~ - = , - -
Contract No. FO4703-91-C-0112 RTI Report No. RTI/5180/77-43F
Task No. 10/95-77, Subtask 2.0 September 10, 1996
Modeling Unlikely Space-Booster
Failures in Risk Calculations
Final Report
Prepared by
James A. Ward, Jr.
Robert M. Montgomery
of
Research Triangle Institute
Center for Aerospace Technology
Launch Systems Safety Department
Prepared for
Department of the Air Force
45th Space Wing (AFSPC)
Safety Office - 45 SW/SE
Patrick AFB, FL 32925
and
Department of the Air Force
30th Space Wing (AFSPC)
Safety Office - 30 SW /SE
Vandenberg AFB, CA 93437
Distribution authorized to US Government agencies and their contractors to protect administrative/
operational use data, 10 September 96. Other requests for this document shall be referred to the 30th Space
Wing (AFSPC) Safety Office (30 SW/SE), Vandenberg AFB, CA 93437, or 45th Space Wing (AFSPC)
Safety Office (45 SW/SE), Patrick AFB, FL 32925.
Form Approved
REPORT DOCUMENTATION PAGE 0MB No. 0704-0188
Public tel)Ort1ng burden for this collection of information is estimated to average 1 hour per response. induding the time for reviewing instructions, searching exi5ting data sources.
gathering and maintain in!,! the data needed, and completing and rev,ew,ng the collection of Information. Send comments r~ardlng tlils burden estimate or any other aspect of this
collection of Information, including suggestions tor reducing this burden. tO Washington Headquarters Services, Directorate or Information Operations and Reports, 1215 Jefferwn
Davis Highway, Suite 1204, Arlington, VA 12202-4302, and to the Office of Management and Budget. Paperwork Reduction Project(0704-0188), Washington. DC 20503.
1. AGENCY USE ONLY (Leave blank) ~.• REPORT DATE 3. REPORT TYPE AND DATES COVERED
. eptember 10, 1996 1 Final
4. TITLE AND SUBTITLE 5. FUNDING NUMBERS
f.1odeling Unlikely Space-Booster Failures in Risk Galculations C: F04703-91-C-o112
TA:10/95-TT
6. AUTHORW •
James A. ard, Jr.
Robert M. Montgomery
7. PERFORMING ORGANIZATION NAME(S) AND ADDRESS(ES) 8. PERFORMING ORGANIZATION
REPORT NUMBER
Research Triangle Institute * ACTA, Inc. **
113000 N. Atlantic Avenue · Skypark3 RTl/5180m-43F
Cocoa Beach, FL 32931 23430 Hawthorne Blvd., Suite 300
Torrance, CA 90505
9. SPONSORING/MONITORING AGENCY NAME(S) AND ADDRESS(ES) 10. SPONSORING/ MONITORING
AGENCY REPORT NUMBER
Department of the Air Force (AFSPC) Department of the Air Force (AFSPC)
30th Space Wing 45th Space Wing r\~'1~.1
- - -m.-t1<a-a
Vandenberg AFB, CA 93437 Patrick AFB, FL 32925
-Mr. Martin Kinna (30 SW/SEY) Louis J. Ullian, Jr. (45 SW/SED)
11. SUPPLEMENTARY NOTES
* Subcontractor
" Prime Contractor
12a. DISTRIBUTION/AVAILABILITY STATEMENT 12b. DISTRIBUTION CODE
Distribution authorized to US Government agencies and their contractors to protect
administrative/operational use data; 10 September 96. Other requests for this document shall
be referred to the 30th Space Wing (AFSPC) Safety Office (30 SW/SE),Vandenberg AFB, CA
93437, or 45th Space Wing (AFSPC) Safety Office (45 SW/SE), Patrick AFB, FL 32925. (!__,
13. ABSTRACT (Maximum 200 words)
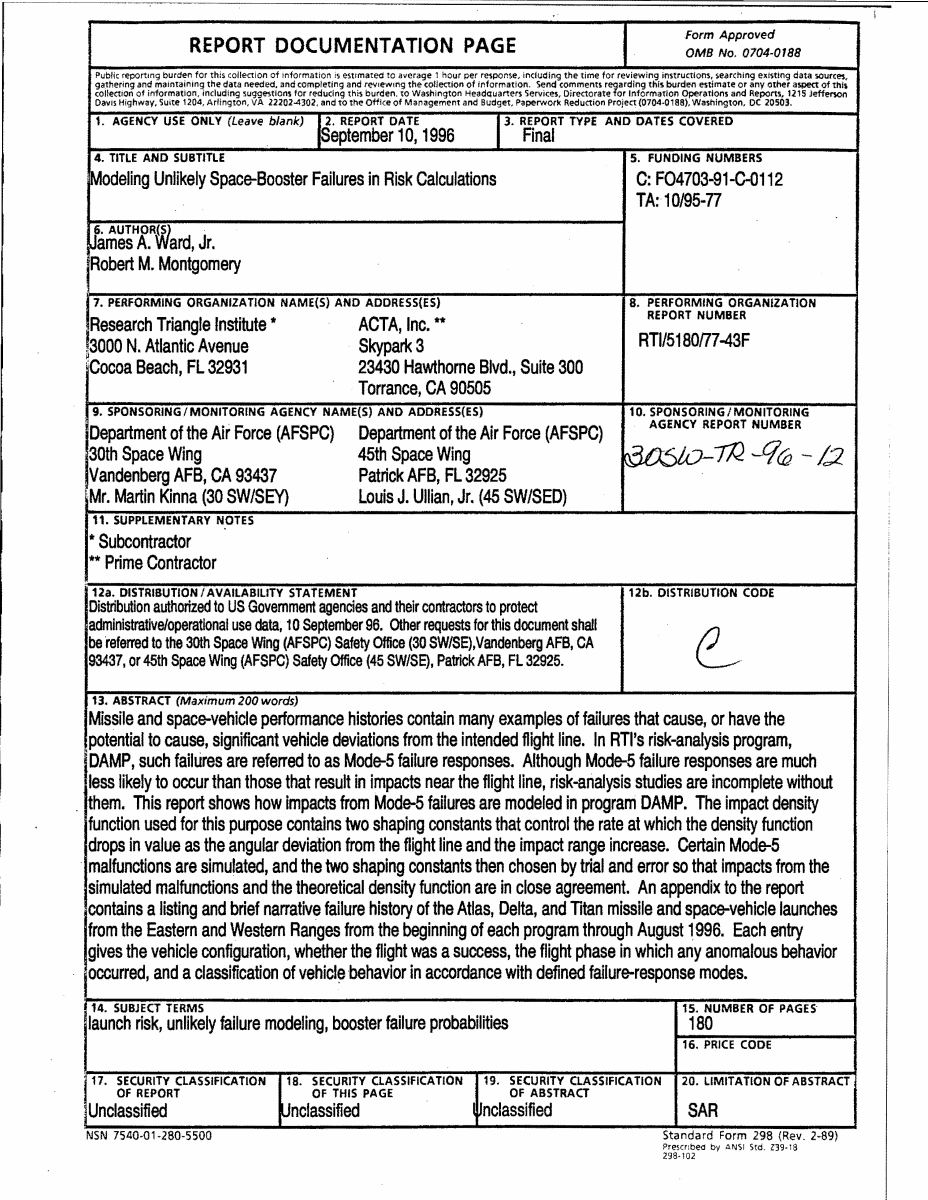
Missile and space-vehicle performance histories contain many examples of failures that cause, or have the
potential to cause, significant vehicle deviations from the intended flight line. In RTl's risk-analysis program,
DAMP, such failures are referred to as Mode-5 failure responses. Although Mode--5 failure responses are much
less likely to occur than those that result in impacts near the flight line, risk-analysis studies are incomplete without
them. This report shows how Impacts from Mode-6 failures are modeled in program DAMP. The impact density
function used for this purpose contains two shaping constants that control the rate at which the density function
drops In value as the angular deviation from the flight line and the impact range increase. Certain Mode--5
•malfunctions are simulated, and the two shaping constants then chosen by trial and error so that impacts from the
simulated malfunctions and the theoretical density function are in close agreement. An appendix to the report
contains alisting and brief narrative failure history of the A~as, Delta, and Titan missile and space-vehicle launches
from the Eastern and Western Ranges from the beginning of each program through August 1996. Each entry
gives the vehicle configuration, whether the flight was asuccess, the flight phase in which any anomalous behavior
occurred, and aclassification of vehicl~ behavior in accordance with defined failure-response modes.
14. SUBJECT TERMS 15. NUMBER OF PAGES·
launch risk, unlikely failure modeling, booster failure probabilities 180
16. PRICE CODE
17. SECURITY CLASSIFICATION 18. SECURITY CLASSIFICATION 19. SECURITY CLASSIFICATION 20. LIMITATION OF ABSTRACT
OF REPORT OF THIS PAGE OF ABSTRACT
Unclassified lJnclassified lnclasslfled SAR
NSN 7540-01-280-5500 Standard Form 298 (Rev. 2-89)
Prescribed by AIIISI Std. Z39-18
298·102
Abstract
Missile and space-vehicle performance histories contain many examples of failures that
cause, or have the potential to cause, significant vehicle deviations from the intended
flight line. In RTI's risk-analysis program, DAMP, such failures are referred to as
Mode-5 failure responses. Although Mode-5 failure responses are much less likely to
occur than those that result in impacts near the flight line, risk-analysis studies are
•incomplete without them. This report shows how impacts from Mode-5 failures are
modeled in program DAMP. The impact density function used for this purpose
contains two shaping constants that control the rate at which the density function drops
in value as the angular deviation from the flight line and the impact range increase.
Certain Mode-5 malfunctions are simulated, and the two shaping constants then chosen
by trial and error so that impacts from the simulated malfunctions and the theoretical
density function are in close agreement.
An appendix to the report contains a listing and brief narrative failure history of the
Atlas, Delta, and Titan missile and space-vehicle launches from the Eastern and
Western Ranges from the beginning of each program through August 1996. Each entry
gives the vehicle configuration, whether the flight was a success, the flight phase in
which any anomalous behavior occurred, and a classification of vehicle behavior in
accordance with defined failure-response modes. Various filtering or data weighting
techniques are described. The empirical data are then filtered to estimate (1) failure
probabilities for Atlas, Delta, and Titan, and (2) percentages of future failures that will
result in Mode-5 (and other Mode) responses.
9/10/96 RTI
Table of Contents ·
1. Introduction............................................................................................................................... 1
2. Examples Showing Need for Mode 5 ................................................................................ 3
3. Understanding the Mode-5 Failure Response ................................................................... 7
3.1 Effects of Mode-5 Shaping Consta.nts................................. ".....................................-...... 9
3.2 Effects of Shaping Constant on DAMP Results ........................................................ 9
4. Methodology for Assessing Failure Probabilities ........................................................... 13
4.1 The Parts-Analysis Approach .................................................................................. 13'-
4.2 The Empirical Approach .......................................................................................... 15
5. Computation of Failure Probabilities ............................................................................... 16
5.1 Overall Failure Probability....................................................................................... 16
5.2 Relative and Absolute Probabilities for Response Modes ..................................... 24
5.3 Relative Probability of Tumble for Response-Modes 3 and 4 ............................... 30
6. Shaping Constants Through Simulation .......................................................................... 31
6.1 Malfunction Tum. Simulations...........•...................................................................... 31
6.1.1 Random-Attitu.de Failures ...............-............................................................... 31
6.1.2 Slow-Tum Failures ........................................................................................... 32
6.1.3 Factors Affecting Malfunction-Tum Results ................................................ 33
6.1.4 Malfunction-Tum Results for Atlas IIAS ...................................................... 35
6.2 Shaping Constants for Atlas IIAS ............................................................................ 37
6.2.1 Optimum Mode-5 Shaping Constants ........................................................... 37
6.2.2 Launch-Area Mode-5 Risks ............................................................................ 49
6.2.3 Effects of Mode-5 Constants on Ship-Hit Contours ..................................... 51 I
6.2.4 Range Distributions of Theoretical and Simulated Impacts........................ 58
6.3 Shaping Constants for Delta-GEM .......................................................................... 60
6.3.1 Optimum Mode-5 Shaping Constants ........................................................... 61
6.3.2 Launch-Area Mode-5 Risks ............................................................................ 64
6.4 Shaping Constants for Titan IV................................................................................ 65
6.5 Shaping Constants for LLVl .................................................................................... 69
6.6 Shaping Constants for Other Launch Vehicles ....................................................... 72
7. Potential Future Investigations ......................................................................................... 73
8. Summarv:
., ............................................................................................................................ 74
9/10/96 ii RTI
Appendix A. Failure Response Modes in Program DAMP ............................................... 79
Appendix B. Shaping-Constant Effects on Mode-5 Impact Distributions ........................ 81
Appendix C. Filter Characteristics ....................................................................................... 90
Appendix D. Launch and Performance Histories .............................................................. 96
D.1 Basic Data ................................................................................................................. 96
D.1.1 Data Sources ................................................................................................................................................................... 96
D.1.2 Assignment of Failure-Response Modes...................................................... 98
D.1.3 Assignment of Flight Phase.......................................... ~ ....................................................................... 98
D.1.4 Representative Configurations ................................................................... 100
D.2 Atlas Launch and Performance History .............................................................. 101
D.2.1 A'tlas Launch History ..................................................................................................... 103
D.2.2 Atlas Failure Narratives ........... ~ .................................................................... 115
D.3 Delta Launch and Performance History .............................................................. 133
D.3.1 Delta Launch History................................................................................... 136
D.3.2 Delta Failure Narratives .............................................................................. 142
D.4 Titan Launch and Performance History .............................................................. 146
D.4.1 Titan Launch History ................................................................................... 149
D.4.2 Titan Failure Narratives .............................................................................. 157
D.5 Thor Launch and Performance History (Not Including Delta) ......................... 164
D.5.1 Thor and Thor-Boosted Launch History .................................................... 164
D.5.2 Thor and Thor-Boosted Failure Narratives ............................................... 167
References ............................................................................................................................. 171
9/10/96 iii RTI
Table of Figures
Figure 1. Joust Impact Trace Showing a Mode-5 Failure Response ....................................6
Figure 2. Atlas IIAS Risk Contours for Inner-Ear Injury with A = 3.0.............................. 11
Figure 3. Atlas IIAS Risk Contours for Inner-Ear Injury with A = 3.5.............................. 12
Figure 4. Filter Factor Results for Representative Configurations of Atlas ...................... 23
Figure 5. Combined Random-Attitude and Slow-Tum Results ........................................ 36
Figure 6. Atlas IIAS Breakup Percentages for Random-Attitude Tums ........................... 37
Figure 7. Atlas HAS Impacts with No Breakup ........................................................ ~ ........ 39
Figure 8. Atlas IIAS Impacts with Breakup ......................................................................... 40
Figure 9. Atlas IIAS Simulation Results with B = 1,000 ..................................................... 42
Figure 10. Atlas IIAS Simulation Results with B = 50,000.................................................. 44
Figure 11. Atlas HAS Simulation Results with B = 100,000................................................ 45
Figure 12. Atlas HAS Simulation Results with B = 500,000................................................ 46
Figure 13. Atlas HAS Simulation·Results with B = 5,000,000............................................. 47
Figure 14. Effects of Breakup q-alpha on A for Atlas IIAS ................................................ 49
Figure 15. Mode-5 Density-Function Values at Three Miles ............................................. 51
Figure 16. Atlas IIAS Mode-5 Ship-Hit Contours with A= 3.00 ....................................... 53
Figure 17. Atlas IIAS All-Mode Ship-Hit Contours with A = 3.00.................................... 54
Figure 18. Atlas IIAS Mode-5 Ship-Hit Contours with A= 3.45 ....................................... 55
Figure 19. Atlas IIAS All-Mode Ship-Hit Contours with A= 3.45.................................... 56
Figure 20. Atlas IIAS Mode-5 Ship-Hit Contours with A = 6.30 ....................................... 57
Figure 21. Atlas IIAS All-Mode Ship-Hit Contours with A = 6.30.................................... 58
Figure 22. Impact-Range Distributions .................................................................................. 59
Figure 23. Delta-GEM Breakup· Percentages ....................................................................... 61
Figure 24. Delta-GEM Simulation Results with B ==-1,000.................................................. 62
Figure 25. Delta-GEM Simulation Results with Best-Fit Shaping Constants ................... 63
Figure 26. Titctn·IV Breakup Percentages ................................................................................ 65
Figure 27. Titan·Simulation Results with B = 1,000 ............................................................ 66
Figure 28. Titan Simulation Results with Best-Fit Shaping Constants.............................. 67
Figure 29. LLVl Breakup Percentages ..................................................................................................................... 69
Figure 30. LLVl Simulation Results with B = l,000............................................................ 70
9/10/96 iv RTI
Figure 31. LLVl Simulation Results with Best-Fit Shaping Constants ............................. 71
Figure 32. £-Ratios for Ranges from 1 to 25 Miles .............................................................. 86
Figure 33. Percentage of Impacts Between Flight Line and Any Radial .......................... 87
Figure 34. Percentage of Impacts in 5-Degree Sectors ........................................................ 88
Figure 35. Exponential Weights for Fading-Memory Filters ............................................. 93
Figure 36. Recursive Filter Factor for Last Data Point........................................................ 94
Figure 37, Atlas Launch Summary..................................................................................... 102
Figure 38. Delta Launch Summary." ................................................................................... 135
Figure 39. Titan Launch Summary..................................................................................... 148
Figure 40. Thor Launch Summary ..................................................................................... 164
Table of Tables
Table 1. Effects of Mode-5 Shaping Constant A on Atlas IIA Risks .................................. 10
Table 2. Predicted Failure Probabilities for Representative Configurations .................... 17
Table 3. Predicted Failure Probabilities for All Configurations ........................................ 18
Table 4. Comparison of Weighting Percentages ................................................................. 19
Table 5. Filter Factor Influence on Weighting Percentages ................................................ 21
Table 6. Failure Probabilities for Atlas, Delta, and Titan ................................................... 24
Table 7. Number of Atlas Failures - All Configurations (532 Flights) .............................. 25
Table 8. Number of Delta Failures-All Configurations (232 Flights).............................. 25
Table 9. Number of Titan Failures - All Configurations (337 Flights) .............................. 25
Table 10. Number of Eastern-Range Thor Failures (85 Flights) ........................................ 25
Table 11. Number of Failures for All Vehicles (1186 Flights)............................................ 26
Table 12. Date of Most Recent Failure ................................................................................. 26
Table 13. Percentage Weighting for Sample of 1186 Launches ......................................... 27
Table 14. Response-Mode Occurrence Percentages ............................................................ 27
Table 15. Recommended Response-Mode Percentages for Flight Phases O- 2................ 28
Table 16. Recommended Response-Mode Percentages for Flight Phases O- 1................ 29
Table 17. Absolute Failure Probabilities for Response Modes 1 - 5 .................................. 29
Table 18. Percent of Response Modes 3 and 4 That Tumble .............................................. 30
9/10/96 V
Table 19. Sample Impact Distribution for Atlas IIAS- with No Breakup .......................... 41
Table 20. Shaping Constants for Atlas IIAS......................................................................... 48
Table 21. Shaping Constants and Related Risks for Atlas HAS-......................................... 50
Table 22. Best-Fit Conditions for Atlas IIAS............................................. :.......................... 52
Table 23. Shaping Constants and Related Risks for Delta-GEM ....................................... 64
Table 24. Shaping Consta.nts for Titan IV ............................................................................ 68
Table 25. Shaping Constants for LLVl ................................................................................. 72
Table 26. Summary of A Values for B = 1,000................. ;................................................... 72-
Table 27. Failure Probabilities for Atlas, Delta, and Titan ................................................. 75
Table 28. Recommended Response-Mode Percentages for Flight Phases O-2 ................. 75~
Table 29. Recommended Response-Mode Percentages for Flight Phases O- 1................ 75
Table 30. Absolute Failure Probabilities for Response Modes 1 - 5 .................................. 76
Table 31. Summary of A Values for B = 1,000..................................................................•... 77
Table 32. Summary of Optimum·Mode-5 Shaping Constants ........................................... 77
Table 33. Effect on £-Ratio-of Varying Mode-5 Constant A {B = 1000) - Part 1 ................ 82
Table 34. Effect on £-Ratio-of Varying Mode-5 Constant A {B = 1000) - Part 2 ................ 83
Table 35. Effect on £-Ratio-of Varying Mode-5 Constant B {A = 3) - Part 1 ...................... 84
Table 36. Effect on £-Ratio-of Varying Mode-5 Constant B {A= 3) - Part 2 ...................... 85
Table 37. Filter Application for Failure Probability............................................................ 95
Table 38. Flight-Phase Defi°:,itions........................................................................................ 99
Table 39. Flight Phases by Launch Vehicle ......................................................................... 99
Table 40. Summary of Atlas Vehicle Configurations ....................................................... 101
Table 41. Atlas Launch History ...........................................................•............................... 103
•Table 42. Summary of Delta Vehicle Configurations ....................................................... 133
Table 43. Delta Launch History .......................................................................................... 136
Table 44. Summary of Titan Vehicle Configurations ....................................................... 147 .
Table 45. Titan Launch History .......................................................................................... 149
Table 46. Thor Launch History ........................................................................................... 165
9/10/96 Vl RTI
1. Introduction
The debris from most launch vehicles that fail catastrophically tend to impact close to the
intended flight line. Typical failures that produce such results are premature thrust
termination, stage ignition failure, tank rupture or explosion, or rapid out-of-control
tumble. Less likely malfunctions may cause a vehicle to execute a sustained turn away
from the flight line. Examples are control failures that cause the rocket engine to lock in a
fixed position near null, or failures leading to erroneous orientation of the guidance
platform. Such failures should not be ignored, since they may produce nearly all or a
significant part of the risks to population centers that are more than a mile or so uprange or
many miles away from the flight line. Consequently, RTI has been tasked to estimate the
probabilities of occurrence of these less-likely failures, and to determine optimum values
for the shaping constants of the associated impact-density function
RTI has developed a prototype risk-analysis program (1) to analyze the level of risk in the
launch area when ballistic missiles and space vehicles are launched, and (2) to provide
guidelines for launch operations and launch-area risk management. This program, "facility
DAMage and Personnel injury" (DAMP), uses information about the launch vehicle, its
trajectory and failure responses, and facilities and populations in the launch area to estimate
hit probabilities and casualty expectations. When a missile or spac